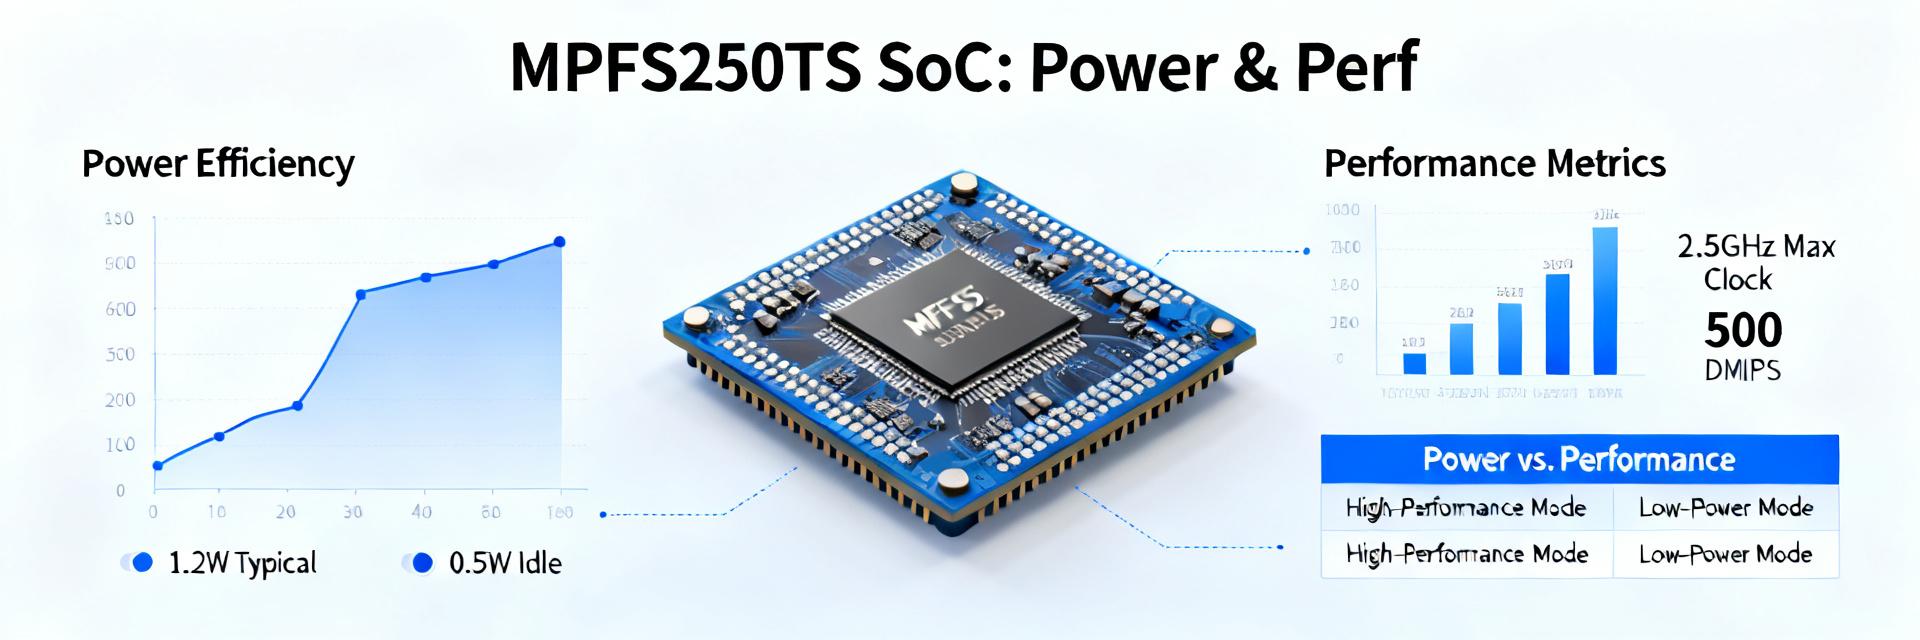
Recent benchmarks for low-power SoC FPGAs show up to ~50% power reduction versus comparable mid-range devices—making device-level power and performance metrics the decisive factor for embedded designs. This report delivers repeatable power and performance metrics, methods, and actionable deployment guidance for engineers evaluating MPFS250TS-FCG1152T2, including tables, charts, and reproducible steps.
Background & Key Specs
1.1 What MPFS250TS-FCG1152T2 is
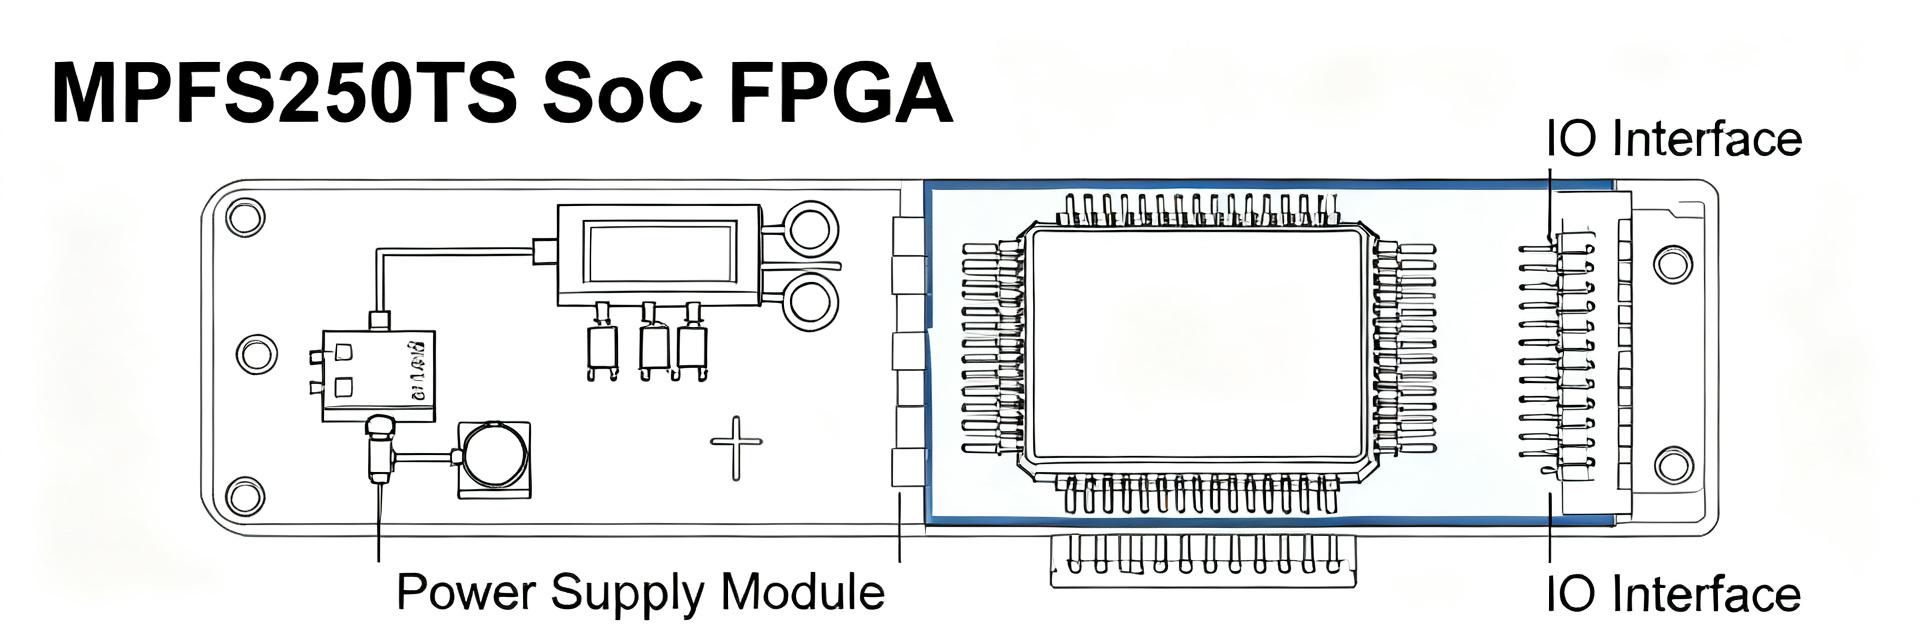
Point: MPFS250TS-FCG1152T2 is a mid-range SoC FPGA class suited for embedded Linux and real-time RISC-V clusters. Evidence: Typical devices provide a mix of fabric logic, hardened CPU clusters, on-chip RAM, and transceivers. Explanation: Key anchor specs—logic elements, 4+ core cluster, 1152 BGA package, industrial temp range, on-chip memory in MBs, multi-Gbps SERDES—define suitability for networked edge and industrial control.
1.2 Why power & performance matter for target designs
Point: Embedded systems face battery, thermal, and latency constraints in industrial and comms applications. Evidence: Designers prioritize idle power, dynamic active power, throughput, latency, and junction temperature as KPIs. Explanation: Quantifying these KPIs shows trade-offs between longevity and deterministic response for US market systems such as remote telemetry or edge inference nodes.
Benchmarking Methodology
2.1 Testbed & measurement setup
Point: Reproducible measurement requires controlled boards and calibrated instruments. Evidence: Use a development board with regulated rails, reference Linux image, programmable load, high-resolution power monitor (1mW resolution), and thermocouples at die-to-package interface. Explanation: Document ambient (23±2°C), sampling rate (1kHz), and supply calibration; include a checklist of equipment and pre-test warm-up to ensure repeatability.
| Item | Model/Setting | Notes |
|---|---|---|
| Power Monitor | Precision DC meter, 1mW | Measure Vcore/Vccio separately |
| Thermal Sensor | TC at package and ambient | Log junction estimates |
| Host Image | Minimal Linux + perf tools | Reproducible boot config |
2.2 Workloads, metrics & reporting format
Point: Define workloads and exact metrics for clarity. Evidence: Include idle, boot, synthetic compute kernels, memory bandwidth tests, and transceiver I/O stress. Explanation: Capture Vcore/Vccio currents, dynamic power vs frequency, MACs/s or MIPS, memory BW, latency percentiles; report as time-series power, CDF latency, and normalized throughput bar charts for easy comparison.
Power Metrics Analysis
3.1 Idle, standby & boot power profile
Point: Baseline phases reveal leakage and power state transitions. Evidence: Measure idle, suspend, and boot with separate rail logs and temperature sweeps. Explanation: Present tables of mW per rail, and note temperature sensitivity; thresholds such as <200mW idle or X mW suspend can be decisive for battery-backed designs (adjust per system capacity).
3.2 Active/dynamic power vs workload and frequency
Point: Dynamic power scales with workload intensity and clock rate across domains. Evidence: Break down power by CPU cluster, fabric, I/O, and DDR while sweeping core frequency. Explanation: Use delta-power attribution (active minus idle) and plot domain-stacked bars; thermal coupling may increase apparent power—compensate via controlled ambient and steady-state windows.
Performance Metrics Analysis
4.1 Compute throughput & latency benchmarks
Point: Throughput and tail latency determine suitability for real-time and inference tasks. Evidence: Run single-core vs multi-core kernels, context-switch stress, and RT-latency probes capturing 50/95/99 percentiles. Explanation: Report MIPS or ops/sec, show degradation under context pressure, and use percentiles to reveal worst-case behavior critical to control systems.
4.2 Memory, interconnect & I/O performance
Point: Memory and interconnect bottlenecks often constrain system-level performance. Evidence: Measure DDR bandwidth/latency, fabric throughput, and SERDES effective throughput under simultaneous load. Explanation: Correlate I/O utilization to increased power and latency; identify when optimizing memory timing yields better perf/watt than raising core frequency.
Comparative Analysis & Edge Cases
5.1 Head-to-head: similar mid-range SoC baselines
Point: Apples-to-apples comparisons require normalized workloads and envelope constraints. Evidence: Normalize throughput targets and thermal envelopes, then tabulate power@throughput, perf/W, peak temp, and package thermal impedance. Explanation: Use these normalized metrics to select devices when raw throughput or efficiency is the primary criterion without vendor bias.
5.2 Thermal throttling, extreme temps & reliability notes
Point: Sustained performance can be limited by thermal rollover and derating. Evidence: Run sustained and burst workloads across -40°C to +125°C junction estimates to observe throttling points. Explanation: Provide derating curves and recommend guardbands; systems exposed to extremes must prioritize thermal paths and conservative power budgets to maintain reliability.
Design & Deployment Recommendations
6.1 Optimizing for power efficiency (practical checklist)
Point: Practical design choices yield large power savings. Evidence: Apply dynamic frequency scaling, domain gating, I/O power-down, relaxed memory timings, and board-level heatsinking. Explanation: Quick wins include aggressive idle gating and peripheral power islands; long-term changes include thermal vias and optimized PCB planes to reduce junction rise and improve sustained perf/W.
6.2 When to prioritize performance vs power (decision framework)
Point: A decision matrix helps architects pick defaults. Evidence: Map use-cases—battery sensor (maximize battery life), edge inference (balance perf/W), industrial control (prioritize deterministic latency). Explanation: Recommend defaults per case (e.g., conservative clocks for battery, higher cores and cooling for inference) and include estimated trade-offs as percent perf/W improvements from each change.
Key Summary
- MPFS250TS-FCG1152T2 evaluation should start with controlled baseline captures: idle, boot, and active domain breakdowns to quantify leakage and active dynamic power across rails.
- Use a standardized testbed and workloads—synthetic compute, memory BW, and SERDES stress—and collect time-series power and latency percentiles for repeatable performance comparisons.
- Optimize systems via domain gating, DFS, I/O power management, and board thermal design; prioritize perf/W based on use-case with clear derating margins for extreme temperatures.
Common Questions
How reproducible are the power measurements and what controls are required?
Reproducibility depends on instrument resolution, warm-up, and ambient control. Use calibrated power monitors, fixed ambient (23±2°C), consistent boot images, and scripted workloads. Record raw CSV logs with timestamps and thermocouple readings, and repeat runs to compute mean and percentile stability.
What minimal test scripts and output formats are recommended?
Provide shell scripts to invoke workloads and capture perf counters. Example JSON line for a sample log: {"timestamp":"T","vcore_mW":123,"vccio_mW":45,"workload":"mem_bw","throughput_MBps":1024}. Store per-run CSV and archive config files for traceability.
What quick hardware changes yield the biggest perf/W gains?
Quick wins include enabling domain gating, tuning DVFS governors for workload profiles, and optimizing memory timing. At board level, add thermal vias and improve airflow. Measure incremental gains per change to prioritize efforts and avoid over-provisioning cooling.
When should engineers prioritize performance versus power in deployment?
Prioritize performance in low-latency real-time applications and edge-inference models. Prioritize power in remote, battery-driven sensor interfaces. This tradeoff ensures maximum life cycle efficiency and sustained system reliability.
Summary
Repeatable metrics focused on idle/active power, per-domain dynamic breakdowns, throughput, and latency percentiles are decisive for selecting and deploying MPFS250TS-FCG1152T2. Engineers should collect scripted logs, domain-separated power traces, and thermal readings, then iterate with DFS and thermal improvements to meet system KPIs.